Overview
MIP is an AI-native research platform for biology. It combines a domain-specialized reasoning engine with scientific databases, a live literature index, uploaded files, and cloud compute so you can ask questions, analyze data, run workflows, and generate structured outputs from one place. The platform is built around four layers: a reasoning layer that understands biological entities and relationships; a data layer that connects to public databases and your uploaded files; a compute layer that can execute code and run autonomous jobs; and an output layer that turns results into documents, spreadsheets, figures, code, and molecular viewers.MIP is a research and decision-support tool. Outputs should be reviewed by a qualified domain expert before being used in publications, clinical work, regulatory work, or other high-stakes settings.
Who MIP is for
MIP is built for researchers and teams working across biology and biomedicine. This includes:- Molecular and cell biologists investigating gene function, protein interactions, and disease mechanisms
- Bioinformaticians running pipelines, validating data, and exploring multi-omics datasets
- Drug discovery scientists mapping targets, pathways, and compound activity
- Translational researchers bridging bench findings with clinical and population data
- Lab directors and principal investigators overseeing analysis across projects and team members
- Scientific writers and reviewers turning literature and analysis into structured drafts
Architecture
1
Reasoning layer
A domain-specialized AI engine understands biological entities and relationships: genes, variants, proteins, pathways, diseases, drugs, phenotypes, experiments, and datasets. It decomposes complex questions into tool calls, searches relevant databases, interprets results, and synthesizes answers with citations.
2
Data layer
MIP connects to public scientific databases, live literature sources, web search, and files you upload or generate in the platform. Files can be referenced directly in chat, code execution, and background jobs.
3
Compute layer
A private execution environment can run Python and R with scientific libraries, and background jobs can run longer autonomous workflows in isolated sandboxes.
4
Output layer
MIP creates structured artifacts such as research briefs, evidence tables, figures, spreadsheets, code files, protein viewers, paper drafts, and downloadable job outputs.
Research modes
The chat interface supports two selectable research modes.
Research mode is selected before the first message and then locked for the chat, so follow-up turns stay coherent.
Uploaded data and files
MIP supports many research file types through chat uploads, the Files page, code execution, and background jobs. Common inputs include:- Tables: CSV, TSV, JSON, XLSX
- Genomics and sequence files: VCF, FASTA, BED, MTX
- Single-cell and omics files: H5AD, count matrices, metadata tables
- Documents: PDF, TXT, Markdown, protocols, manuscripts
- Images and figures: PNG, JPG, SVG
- Archives: ZIP and GZ files
@ in chat.
Data sources
MIP integrates evidence from public databases across scientific categories. Available sources can vary by capability and plan.Output types
Research briefs and evidence tables
Research briefs and evidence tables
Summaries, source-backed comparisons, contradiction analysis, citation tables, and literature landscapes.
Spreadsheets and data exports
Spreadsheets and data exports
Tabular data in CSV or spreadsheet format for downstream analysis or sharing.
Code files and execution results
Code files and execution results
Python or R scripts, statistical outputs, transformed datasets, and generated figures. See Code Execution.
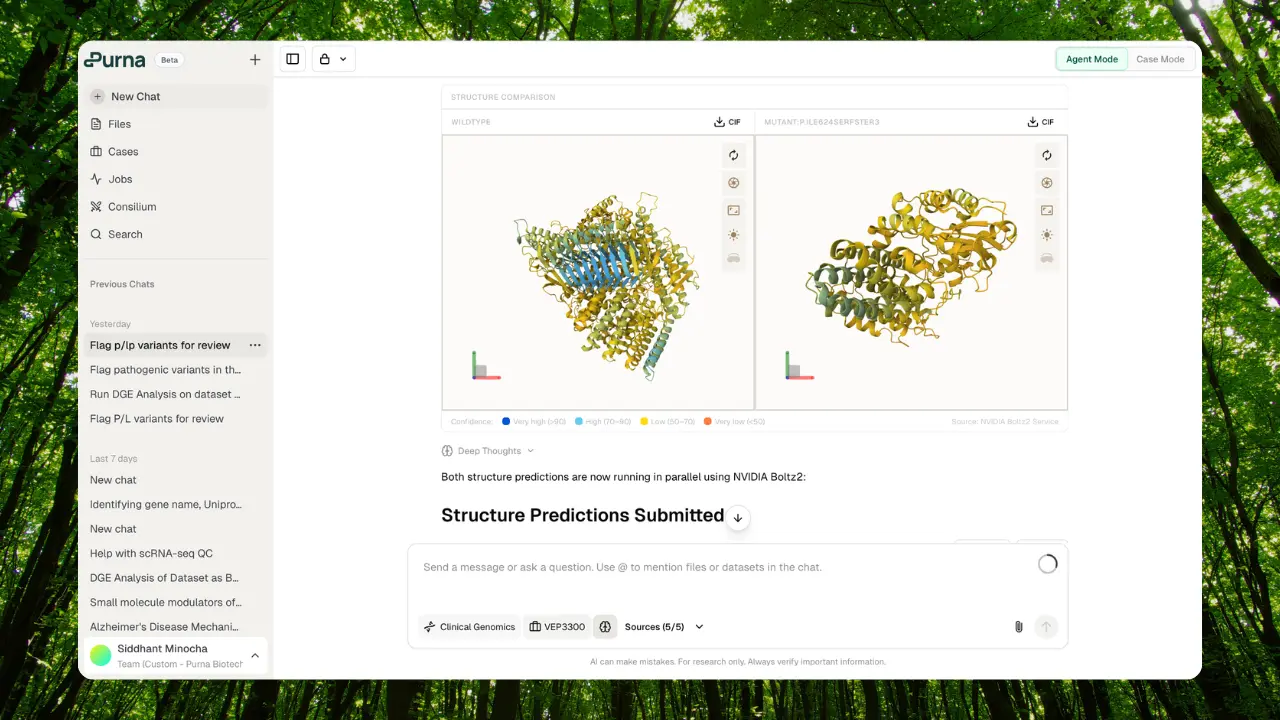
Protein and structure outputs
Protein and structure outputs
Protein visualizations, sequence viewers, model outputs, structure predictions, and molecular design artifacts.
Hypothesis evaluation
Hypothesis evaluation
Multi-agent debate outputs including consensus, unresolved tensions, minority dissent, and supporting evidence. See Consilium.
Visualizations and figures
Visualizations and figures
Charts, scientific figures, plots, pathway maps, and image outputs generated from natural language or code.
Limitations
- MIP does not make autonomous clinical, regulatory, or experimental decisions.
- AI-generated analysis should be verified against primary sources and underlying data.
- Database-backed answers reflect the source records available at query time.
- Uploaded-file analysis depends on file quality, metadata clarity, and the context you provide.
- Code execution and background jobs can produce incorrect results if the requested analysis is underspecified or the input data is malformed.
Security and privacy
- Data is encrypted in transit and at rest.
- Private chats remain visible only to their owner unless shared.
- Team-visible projects let collaborators access selected workspaces.
- Uploaded files and generated outputs are scoped to your account, project, and sharing settings.
- Data access and mutations are logged for auditability.
Do not include direct identifiers, secrets, credentials, or confidential third-party data in prompts, file names, project names, or shared conversations unless your organization has approved that workflow.