
What you can analyze
Depending on your data and the available methods, Purna can help with:- Dataset inspection and quality control
- Bulk RNA-seq differential expression
- Single-cell and other omics workflows
- Gene, pathway, and enrichment analysis
- Sequence, variant, and genomic interval processing
- Statistical testing and exploratory analysis
- Scientific tables and publication-ready visualizations
The appropriate workflow depends on the structure and quality of your data. Review the proposed design, sample assignments, comparisons, and statistical thresholds before execution.
1. Add data and ask a focused question
Attach the dataset to a new or existing session, then describe the analysis you want. Reference the biological groups, comparisons, or outcomes that matter when you know them.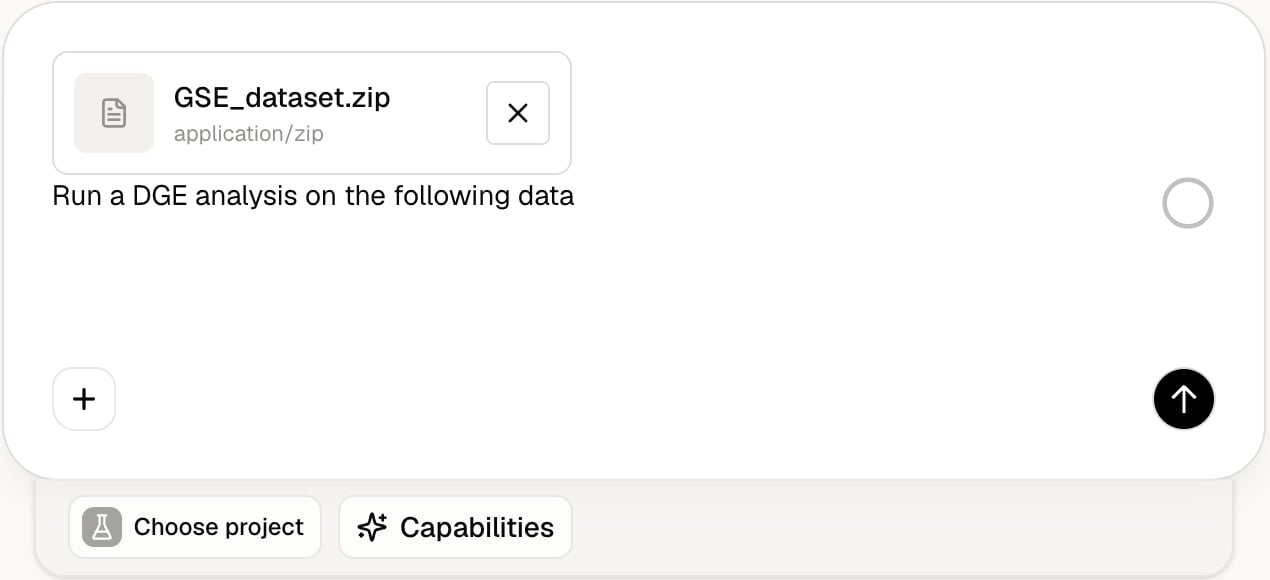
Attach a dataset and describe the analysis in plain language.
- The input files to use
- The experimental groups or conditions
- Relevant covariates, batches, or paired samples
- The required comparison or contrast
- Statistical and fold-change thresholds
- The desired tables, figures, and report format
2. Review the analysis plan
Multi-step dataset analysis uses Planning mode. Before execution begins, review how Purna proposes to handle:- Dataset extraction and file identification
- Count matrix, annotation, and sample metadata matching
- Missing values, duplicate identifiers, and data-type checks
- Low-count or quality-based filtering
- Normalization or transformation
- Statistical design, covariates, and contrasts
- Multiple-testing correction and significance thresholds
- Quality-control figures and expected deliverables
3. Inspect reproducible analysis files
Purna saves the scripts and outputs created during the analysis. You can open a script to inspect the actual processing steps, model design, contrast, thresholds, and export paths.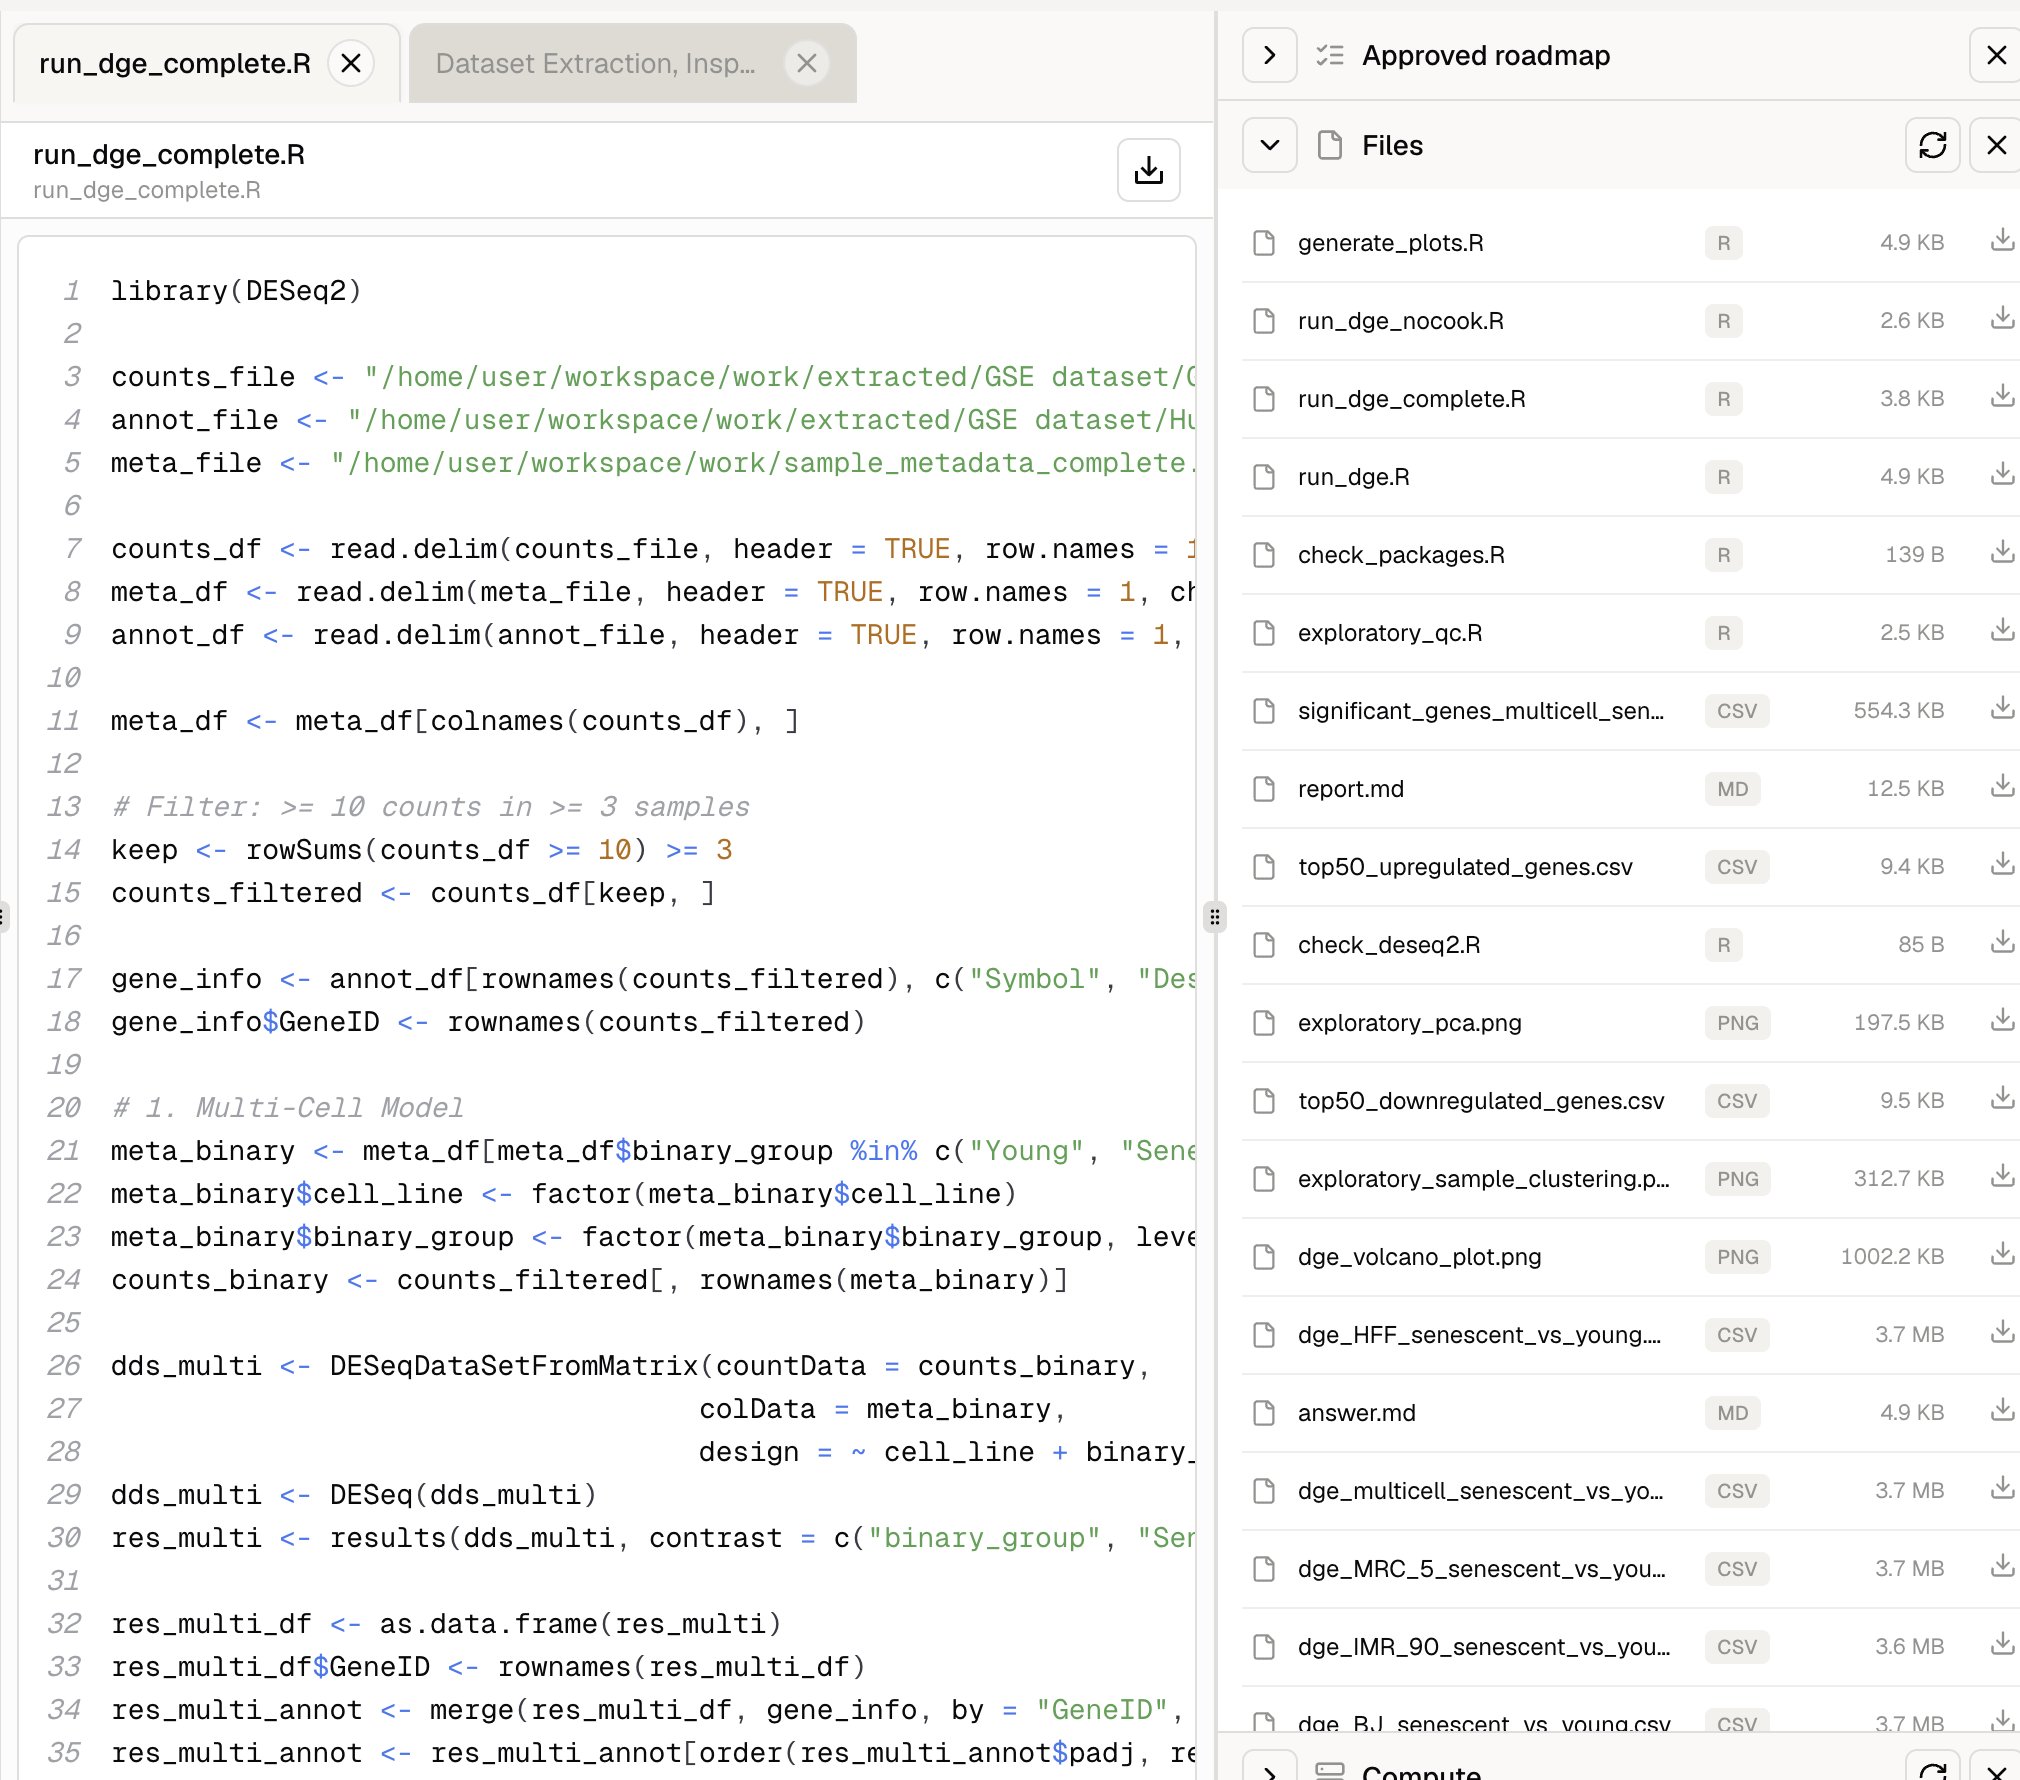
Inspect the retained R analysis alongside its generated files.
Open or download these outputs from Files. The available file types vary with the analysis.
4. Validate sample structure
Quality-control plots help you determine whether the samples behave as expected before interpreting differential results.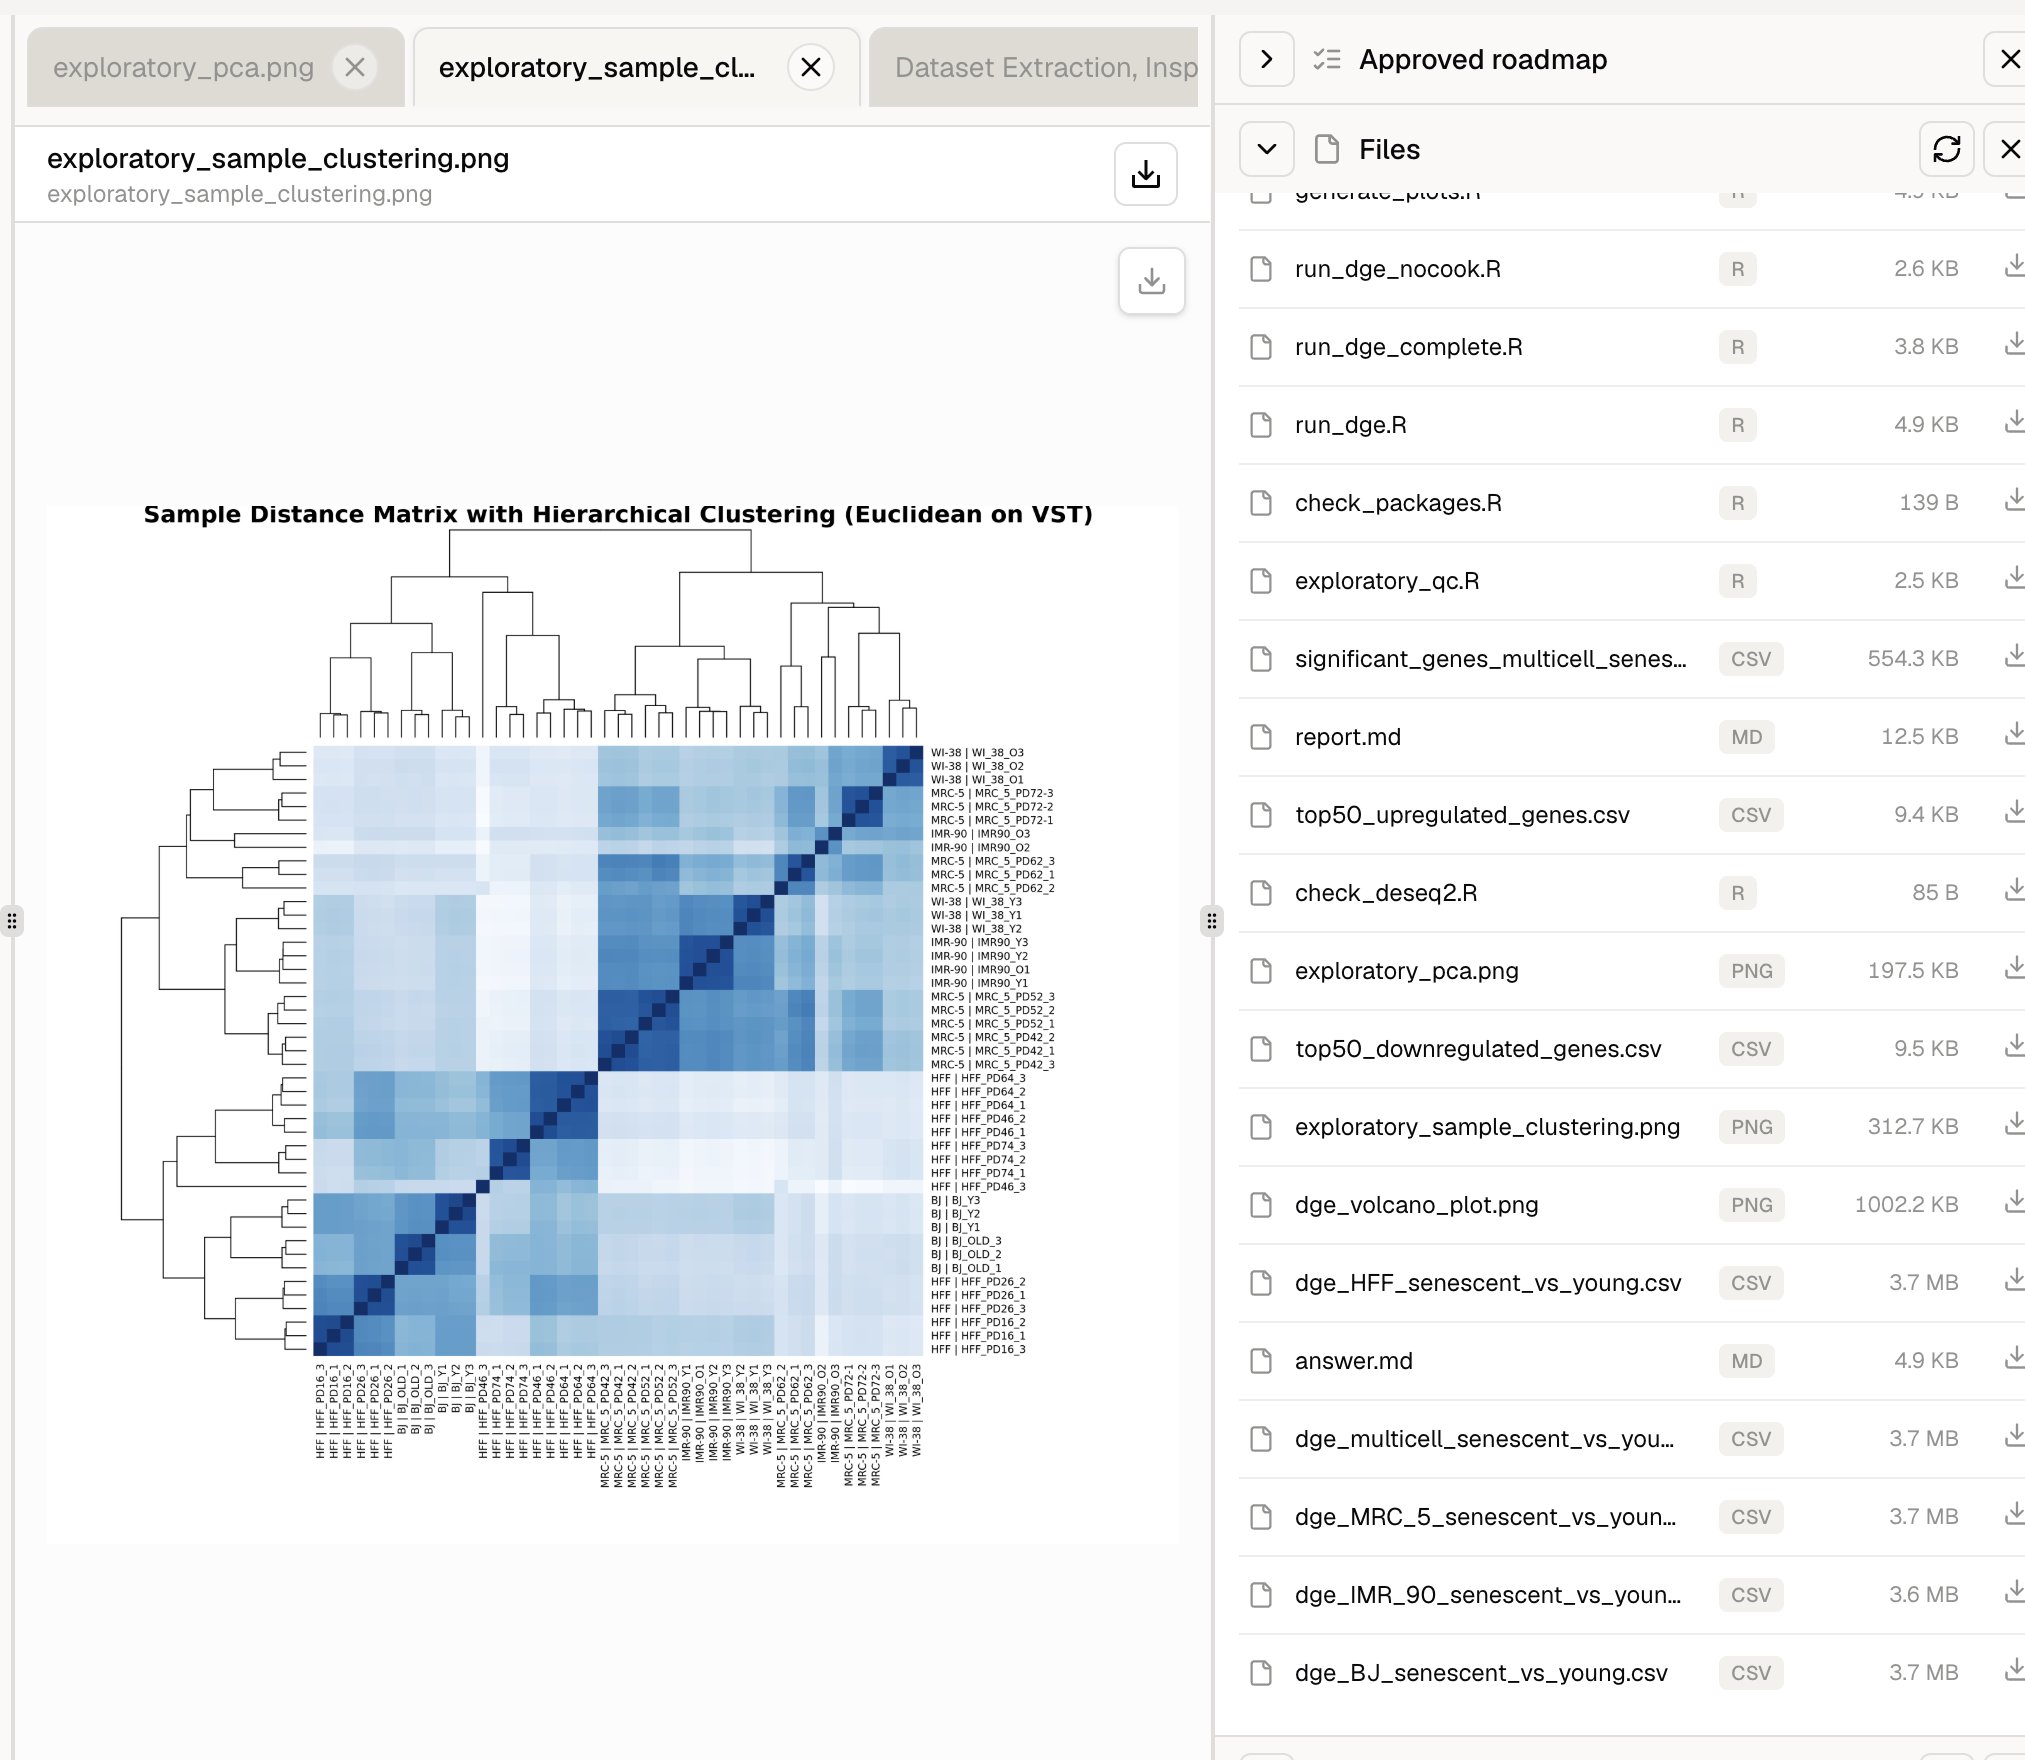
Review sample similarity and hierarchical clustering before interpreting gene-level changes.
- Whether biological replicates cluster together
- Whether experimental groups separate as expected
- Potential outliers or mislabeled samples
- Cell-line or batch effects that may need to be modeled
5. Interpret differential-expression results
The volcano plot combines effect size and statistical significance so you can see the overall result and identify genes that meet the approved thresholds.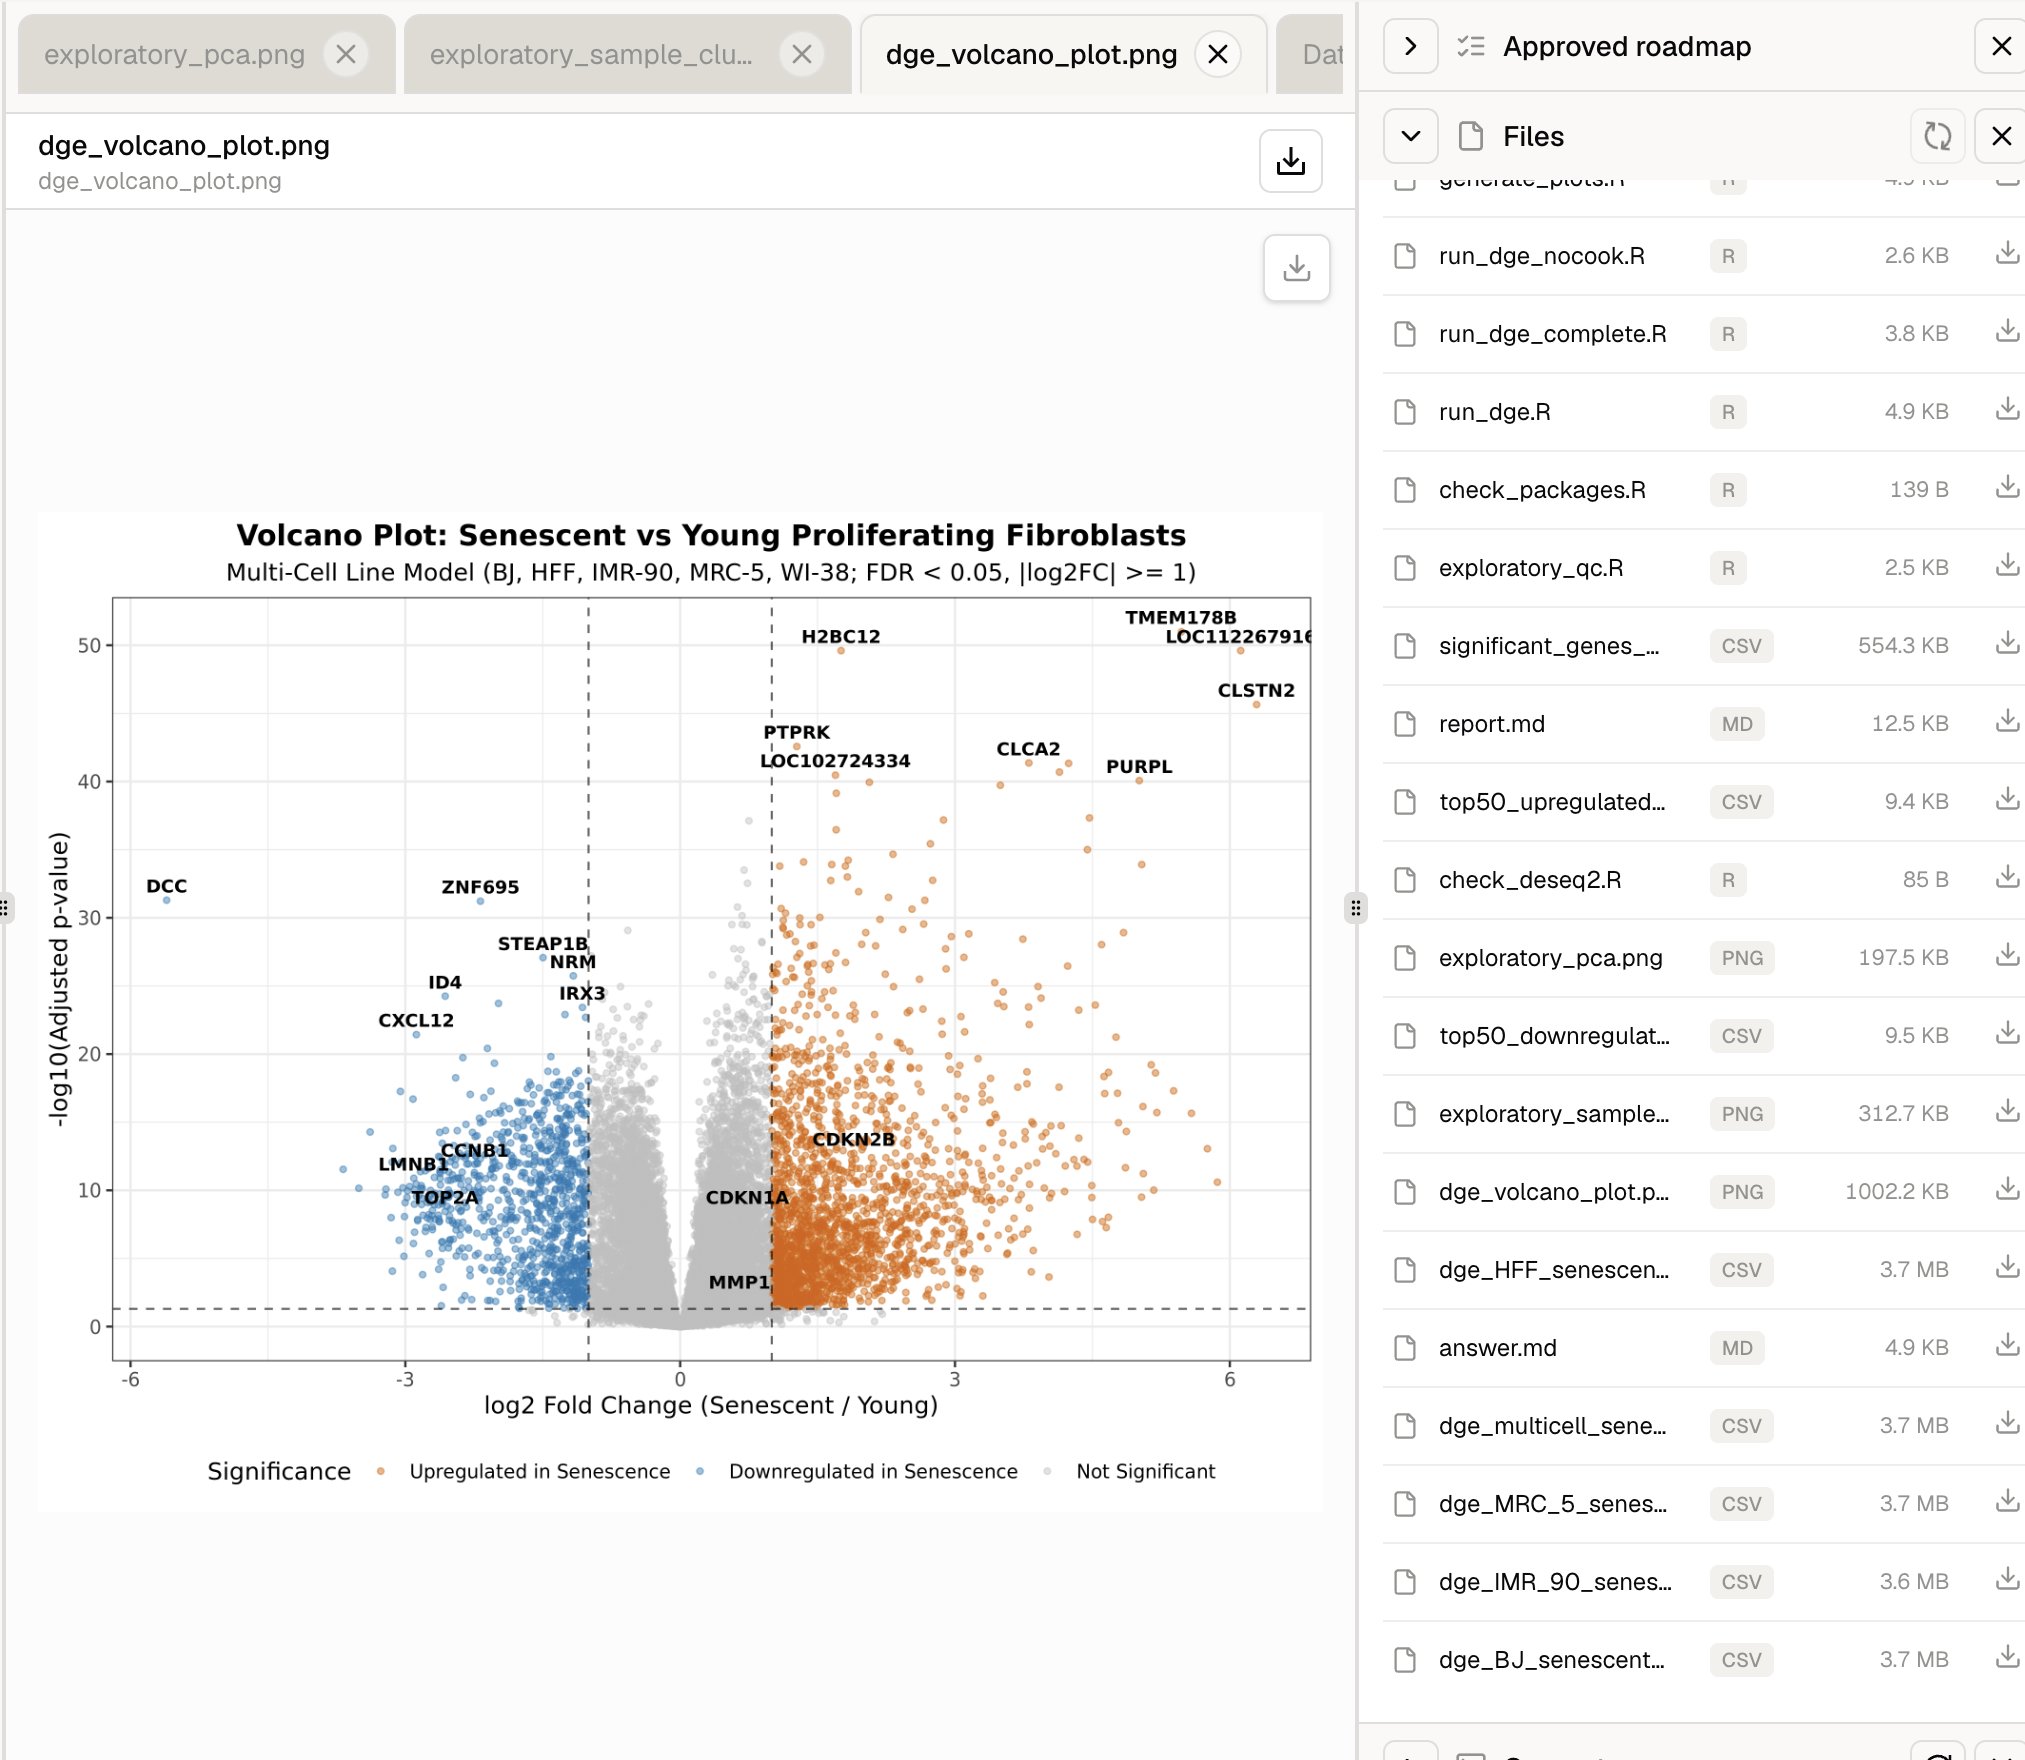
Compare effect size and adjusted significance in the generated volcano plot.
- The horizontal axis represents log2 fold change for senescent relative to young samples.
- The vertical axis represents adjusted statistical significance as
-log10(adjusted p-value). - Orange points are higher in senescence.
- Blue points are lower in senescence.
- Grey points do not meet both the approved FDR and fold-change thresholds.
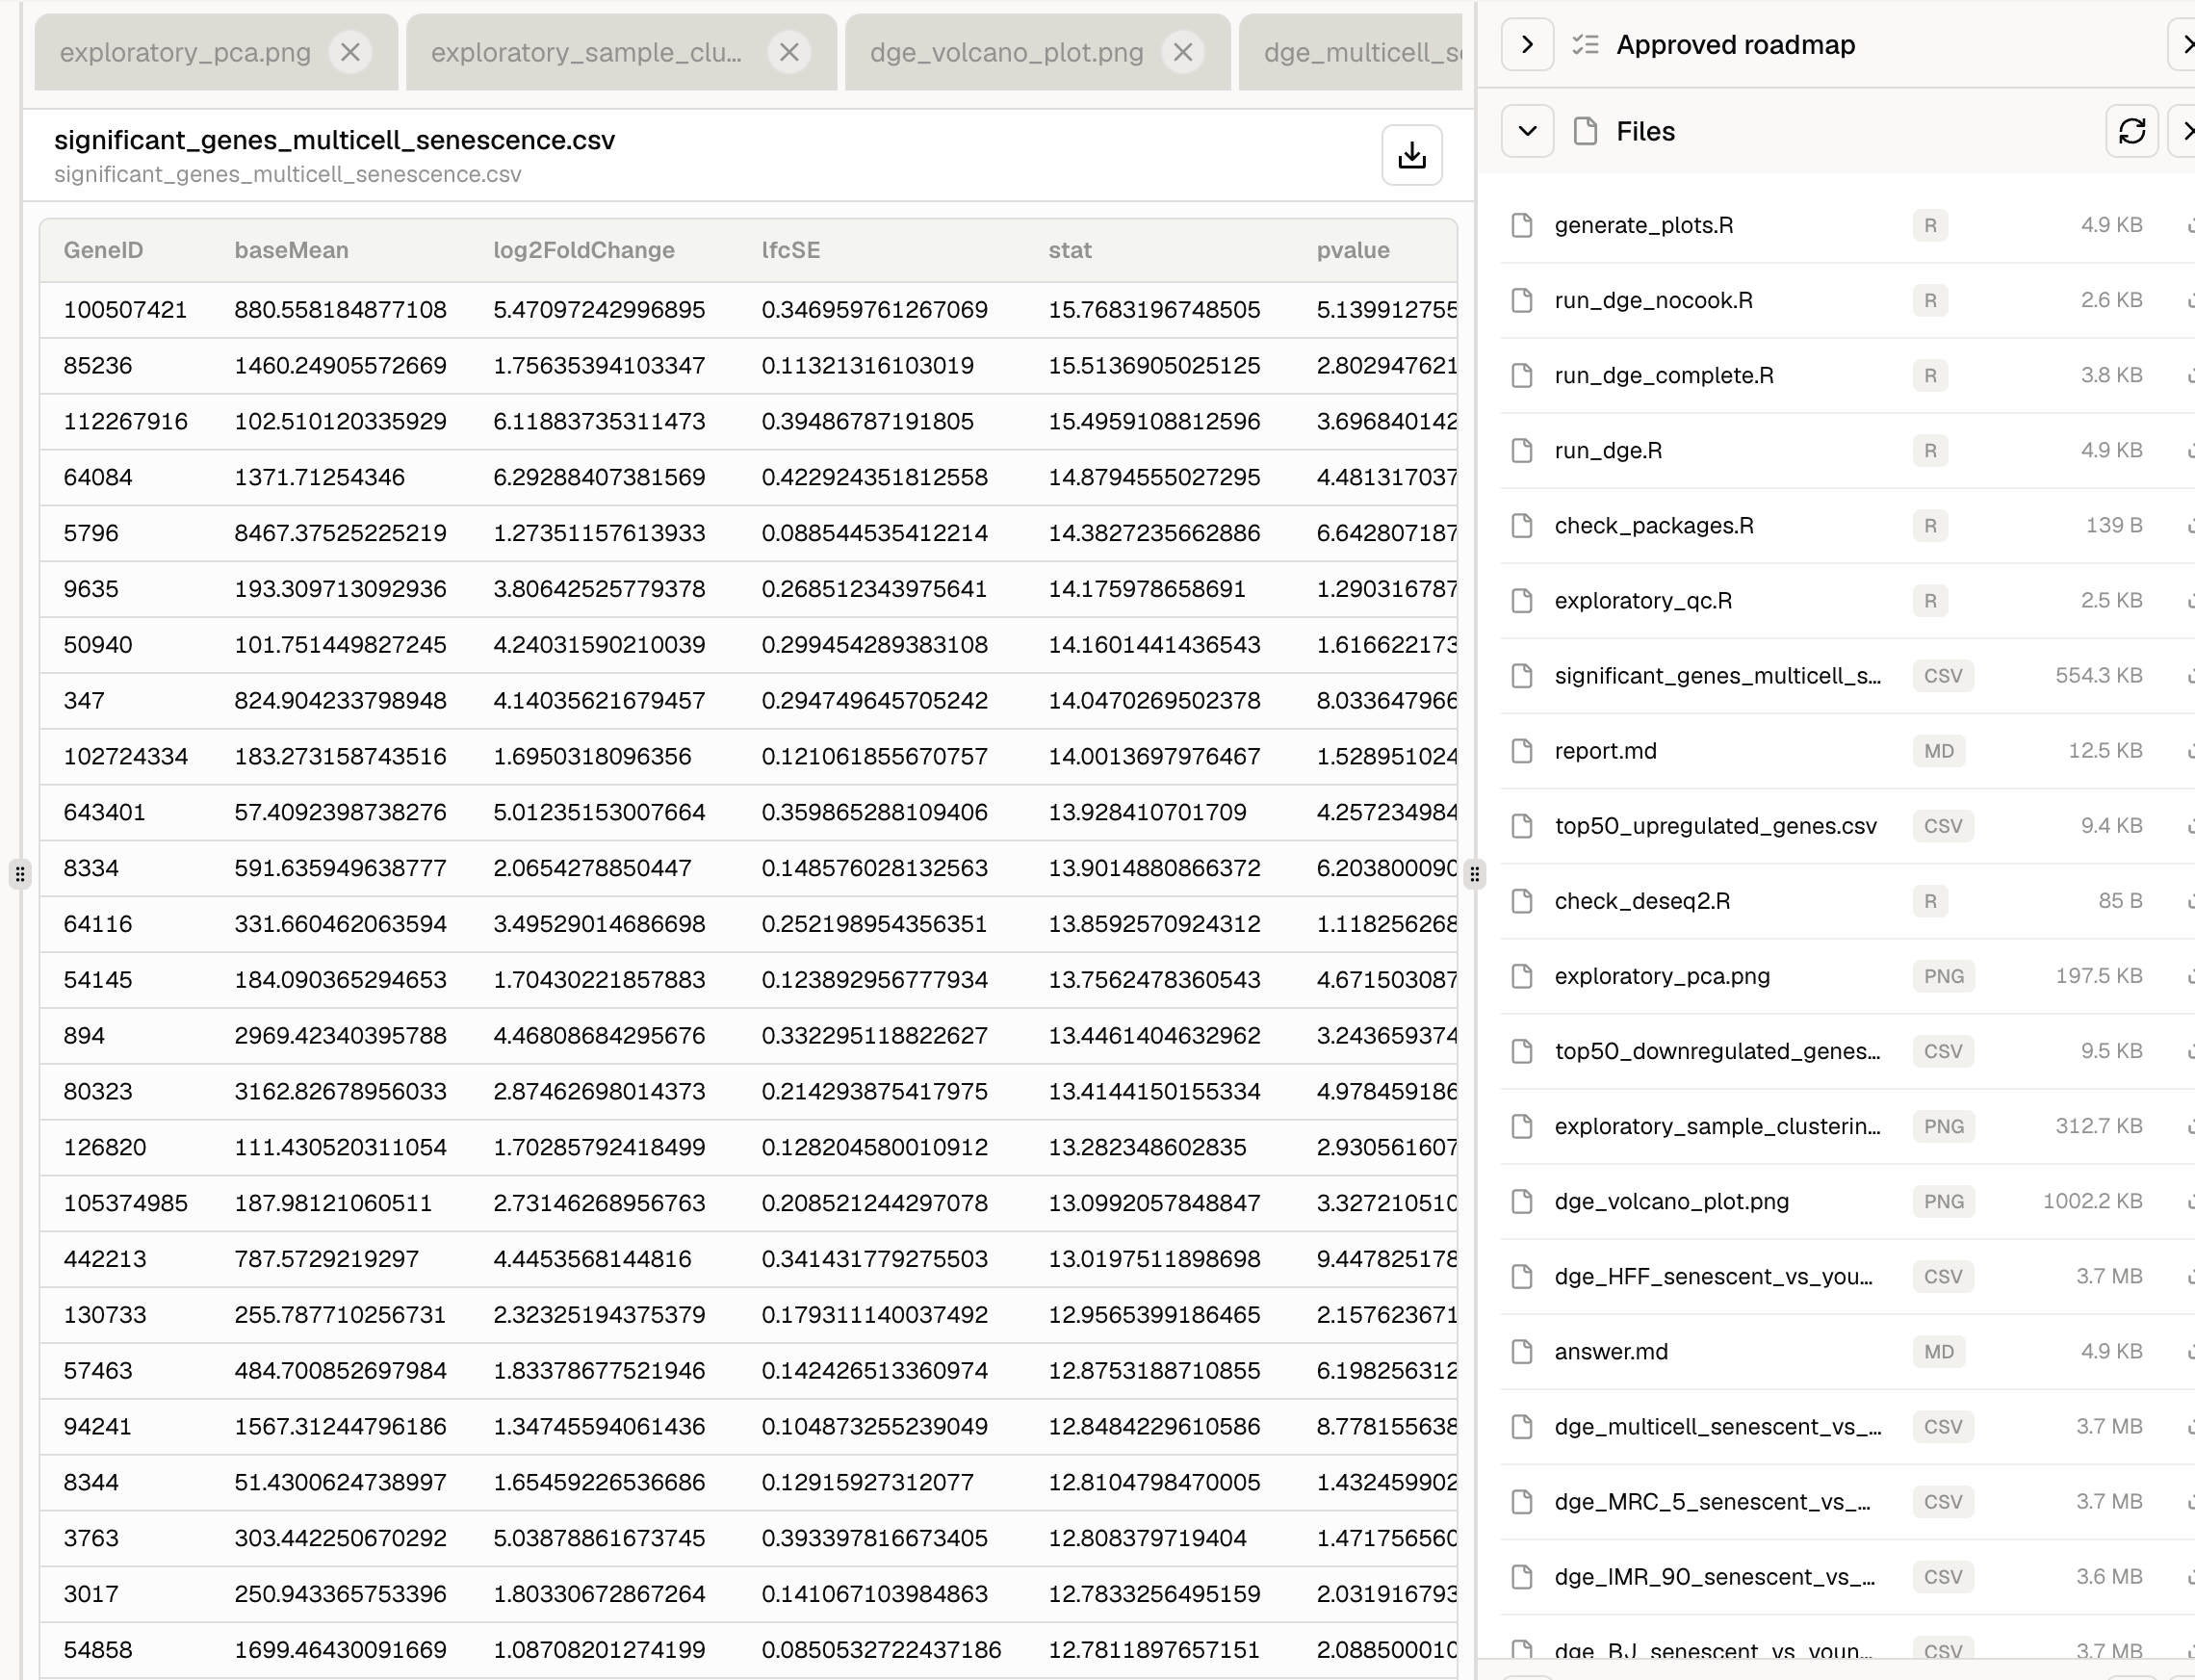
Open the significant-gene table to review effect sizes and model statistics directly.
6. Review the answer and continue the analysis
Begin withanswer.md for the concise interpretation, then open report.md, the complete result tables, figures, and scripts to verify how the conclusions were produced.
You can continue with follow-up requests in the same session. For example:
- Change the FDR or fold-change threshold.
- Examine one cell line or subgroup separately.
- Label a different set of genes on the volcano plot.
- Run pathway enrichment on the significant genes.
- Create an additional heatmap or comparison table.
- Export a result in another format.
Scientific review checklist
Before using the results in a manuscript or decision, confirm that:- Sample identities and group assignments are correct.
- The model design matches the experiment.
- Important covariates and batch effects are handled appropriately.
- Filtering, normalization, and transformation steps are justified.
- The contrast direction is clearly stated.
- Multiple-testing correction is applied where required.
- Every reported gene satisfies the stated thresholds.
- Key findings are supported by the complete result table.